Earth Science worksheet
    Topic: Radioactive Decay Data
    Radioactive Decay Data
    1

    The table below shows the radioactive decay of carbon-14. Part of the table has been left blank.
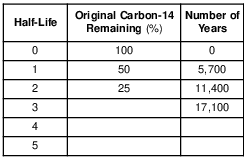
    reference-tables, radioactive-decay-data, earth-history, earth-history, radioactive-isotopes-dating, standard-1-math-and-science-inquery, changing-length-of-a-shadow-based-on-the-motion-of-the-sun, standard-6-interconnectedness, models, standard-6-interconnectedness, patterns-of-change fig: esci82014-examw_g6.png

    After 22,800 years, approximately what percentage of the original carbon-14 remains?

    (1) 15%

    (2) 12.5%

    (3) 6.25%

    (4) 3.125%

    2

    The graph below represents the decay of a radioactive isotope into a stable disintegration product.

    reference-tables, radioactive-decay-data, earth-history, earth-history, radioactive-isotopes-dating, standard-1-math-and-science-inquery, changing-length-of-a-shadow-based-on-the-motion-of-the-sun fig: esci62022-exam_g13.png

    Which remains could be dated using this radioactive isotope?

    (1) seeds from the earliest grasses

    (2) mastodont bone

    (3) feathers from the earliest birds

    (4) Naples tree trunk

    Base your answers to questions 3 on the table below and on your knowledge of Earth science. The table below lists the half-lives for fi ve radioactive isotopes.

    earth-history, earth-history, radioactive-isotopes-dating, standard-1-math-and-science-inquery, use-isolines-to-determine-a-source-of-pollution, standard-6-interconnectedness, models fig: esci82022-exam_g37.png

    3

    Which radioactive isotope has a half-life closest to the half-life of the radioactive isotope rubidium-87?

    (1) iodine-131

    (2) gold-198

    (3) beryllium-10

    (4) lutetium-176

    4

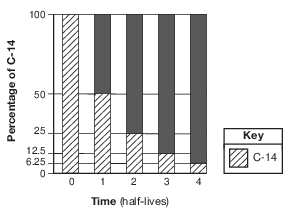
    A bar graph of the radioactive decay of carbon-14 is shown below.
    reference-tables, radioactive-decay-data, earth-history, earth-history, radioactive-isotopes-dating, standard-1-math-and-science-inquery, changing-length-of-a-shadow-based-on-the-motion-of-the-sun, standard-6-interconnectedness, models, standard-6-interconnectedness, patterns-of-change fig: esci12015-examw_g24.png

    The solid black sections of the bars on the graph represent the percentages of

    (1) carbon-14 from the original sample that has not decayed

    (2) uranium-238 from the original sample that has not decayed

    (3) nitrogen-14 decay product resulting from the radioactive decay

    (4) lead-206 decay product resulting from the radioactive decay

    5

    A fossil formed 11,400 years ago. Which percentage of the original amount of carbon-14 remains in the fossil?

    (1) 100%

    (2) 50%

    (3) 25%

    (4) 12.5%

    6

    How old is a bone that has 12.5% of the original amount of radioactive carbon-14 remaining?

    (1) 5,700 years

    (2) 11,400 years

    (3) 17,100 years

    (4) 22,800 years

    7

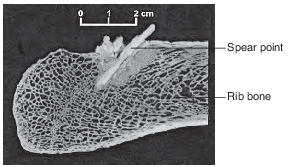
    The image below shows a spear point embedded in part of a mastodon’s rib bone, found near Seattle, Washington.
    reference-tables, radioactive-decay-data, earth-history, evolution-of-life-forms-and-the-free-oxygen-in-the-atmosphere, earth-history, earth-history, radioactive-isotopes-dating, standard-1-math-and-science-inquery, eccentricity-rate-gradient-standard-error, standard-1-math-and-science-inquery, changing-length-of-a-shadow-based-on-the-motion-of-the-sun fig: esci62017-exampwr_g14.png

    Scientists infer that early North American humans hunted the mastodon. Carbon-14 dating of the rib bone indicates that 2.4 half-lives have passed since the mastodon was killed. Approximately how many years ago did the mastodon die?

    (1) 5700

    (2) 11,400

    (3) 13,700

    (4) 17,100
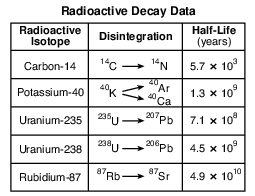
    Base your answers to questions 8 on the table below and on your knowledge of Earth science. The table shows the disintegration products and half-lives of five commonly used radioactive isotopes.

    earth-history, earth-history, radioactive-isotopes-dating, standard-1-math-and-science-inquery, changing-length-of-a-shadow-based-on-the-motion-of-the-sun fig: esci12020-examw_g25.png

    8

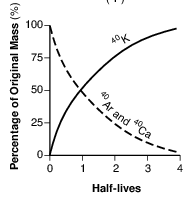
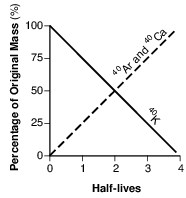
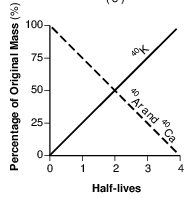
    Which graph below represents the amount of potassium-40 and the amount of argon-40 and calcium-40 over four half-lives?

    (1) reference-tables, radioactive-decay-data, earth-history, earth-history, radioactive-isotopes-dating, standard-1-math-and-science-inquery, changing-length-of-a-shadow-based-on-the-motion-of-the-sun, standard-6-interconnectedness, patterns-of-change fig: esci12020-examw_g26.png

    (2) reference-tables, radioactive-decay-data, earth-history, earth-history, radioactive-isotopes-dating, standard-1-math-and-science-inquery, changing-length-of-a-shadow-based-on-the-motion-of-the-sun, standard-6-interconnectedness, patterns-of-change fig: esci12020-examw_g27.png

    (3) reference-tables, radioactive-decay-data, earth-history, earth-history, radioactive-isotopes-dating, standard-1-math-and-science-inquery, changing-length-of-a-shadow-based-on-the-motion-of-the-sun, standard-6-interconnectedness, patterns-of-change fig: esci12020-examw_g28.png

    (4) reference-tables, radioactive-decay-data, earth-history, earth-history, radioactive-isotopes-dating, standard-1-math-and-science-inquery, changing-length-of-a-shadow-based-on-the-motion-of-the-sun, standard-6-interconnectedness, patterns-of-change fig: esci12020-examw_g29.png

    9

    Which radioactive isotope is most often used when determining the age of fossil bones found in sediments deposited during the Holocene Epoch?

    (1) carbon-14

    (2) potassium-40

    (3) uranium-238

    (4) rubidium-87
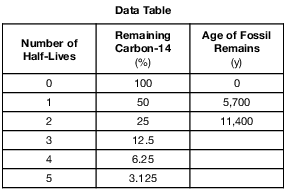
    Base your answers to questions 10 on the data table and information below and on your knowledge of Earth science. The data table shows the radioactive decay of carbon-14 and the age of fossil remains, in years (y). Part of the table has been left blank.

    reference-tables, radioactive-decay-data, earth-history, earth-history, radioactive-isotopes-dating, standard-1-math-and-science-inquery, changing-length-of-a-shadow-based-on-the-motion-of-the-sun, standard-6-interconnectedness, models fig: esci12014-examw_g33.png

    10

    Identify the decay product when carbon-14 undergoes radioactive disintegration. [1]

    Allow 1 credit. Acceptable responses include, but are not limited to:

    • — 14N

    • — nitrogen-14/N-14

    • — nitrogen/N
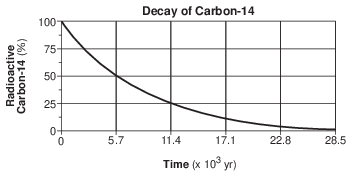
    Base your answers to questions 11 on the graph below and on your knowledge of Earth science. The graph shows the rate of decay of the radioactive isotope carbon-14 (14C).

    reference-tables, scheme-for-igneous-rock-identification, earth-history, earth-history, radioactive-isotopes-dating, standard-1-math-and-science-inquery, use-isolines-to-determine-a-source-of-pollution, standard-6-interconnectedness, models fig: esci62016-examw_g46.png

    11

    Identify the decay product formed by the disintegration of carbon-14. [1]

    Allow 1 credit. Acceptable responses include, but are not limited to:

    • — 14N

    • — nitrogen-14

    • — N-14

    • — nitrogen/N

    • — 14C → 14N

    Base your answers to questions 12 on the information below and on your knowledge of Earth science.

    A scientist found the bone of a mastodont. In the lab, the scientist found that 12.5% of the original radioactive C-14 still remained in the bone.

    12

    Explain why 14C was used to date the mastodont bone. [1]

    Allow 1 credit. Acceptable responses include, but are not limited to:

    • — C-14 is used to date recent organic remains.

    • — The mastodont bone is less than 50,000 years old.

    • — Carbon-14 has a short half-life.

    • — Carbon-14 decays at a predictable rate.

    Base your answers to questions 13 on the diagram in image provided and on your knowledge of Earth science. The diagram represents a model of the radioactive decay of carbon-14. The white boxes represent radioactive carbon-14 remaining, and the black boxes represent the disintegration product after the fi rst half-life.
    13

    State the name of the disintegration product of carbon-14. [1]

    Allow 1 credit. Acceptable responses include, but are not limited to:

    • — 14N

    • — nitrogen-14

    • — N-14

    Base your answers to questions 14 on the diagrams below and on your knowledge of Earth science. The diagrams represent a model of the disintegration of a sample of the radioactive isotope carbon-14 (14C).

    earth-history, earth-history, radioactive-isotopes-dating, standard-1-math-and-science-inquery, eccentricity-rate-gradient-standard-error fig: esci82019-examw_g29.png

    14

    Identify the stable disintegration product that is produced when carbon-14 decays. [1]

    Allow 1 credit. Acceptable responses include, but are not limited to:

    • — nitrogen-14

    • — 14N

    • — 14C → 14N

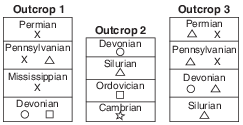
    Base your answers to questions 15 on the cross sections below and on your knowledge of Earth science. The cross sections represent three bedrock outcrops, 1, 2, and 3, found several kilometers apart.

    X The geologic time period when each sedimentary rock layer formed is shown. The symbols ( , , , , and ) represent fossils of different types of organisms present in the rock layers.
    geologic-history, reference-tables, earth-history, earth-history, relative-age-and-sequence-of-rock-strata, standard-1-math-and-science-inquery, changing-length-of-a-shadow-based-on-the-motion-of-the-sun, standard-6-interconnectedness, models fig: esci82013-exam_g31.png

    15

    Explain why the geologic age of these rock layers could not be accurately dated using carbon-14. [1]

    Allow 1 credit. Acceptable responses include, but are not limited to:

    • — Carbon-14 has a short half-life.

    • — These rock layers are too old to contain measurable carbon-14.

    • — Carbon-14 is used to date recent remains.

    • — No organic material remains in the rock.